
The Fall 2026 meeting will take place on Saturday, October 3 at Hanover College. Check-in starts at 9:00 AM, and the welcome address will begin at 9:35 AM.
Dr. Duong Nguyen (nguyen@hanover.edu) is the local organizer, and additional details will be posted as they become available.
Lunch tickets must be purchased through the registration process by the end of the day on Friday, September 25.
Directions
Please see the Campus Map for key building and parking markers. The talks and poster session will take place in the Science Center, and lunch will be provided at the main dining room of the Brown Campus Center.
The closest parking lot is located directly north of the Science Center, and additional parking is available at the Parker Auditorium.
Hotel Accommodations
Holiday Inn Express and Suites
300 Franks Dr, Madison, IN 47250
Please call 812-265-1111 to make a reservation, or email frontdesk.mdoin@gmail.com . Mention the “Hanover College discount”.
King standard room: $181.90 before tax ($209.18 after tax)
Two queen room: $190.40 before tax ($218.96 after tax)
Talks / Posters
Please see the meeting program and the abstracts.
If you are planning to give a contributed talk or present a poster, please submit the Talk / Poster Submission form (NOW CLOSED). The submission deadline is September 18, 2026.
Speaker
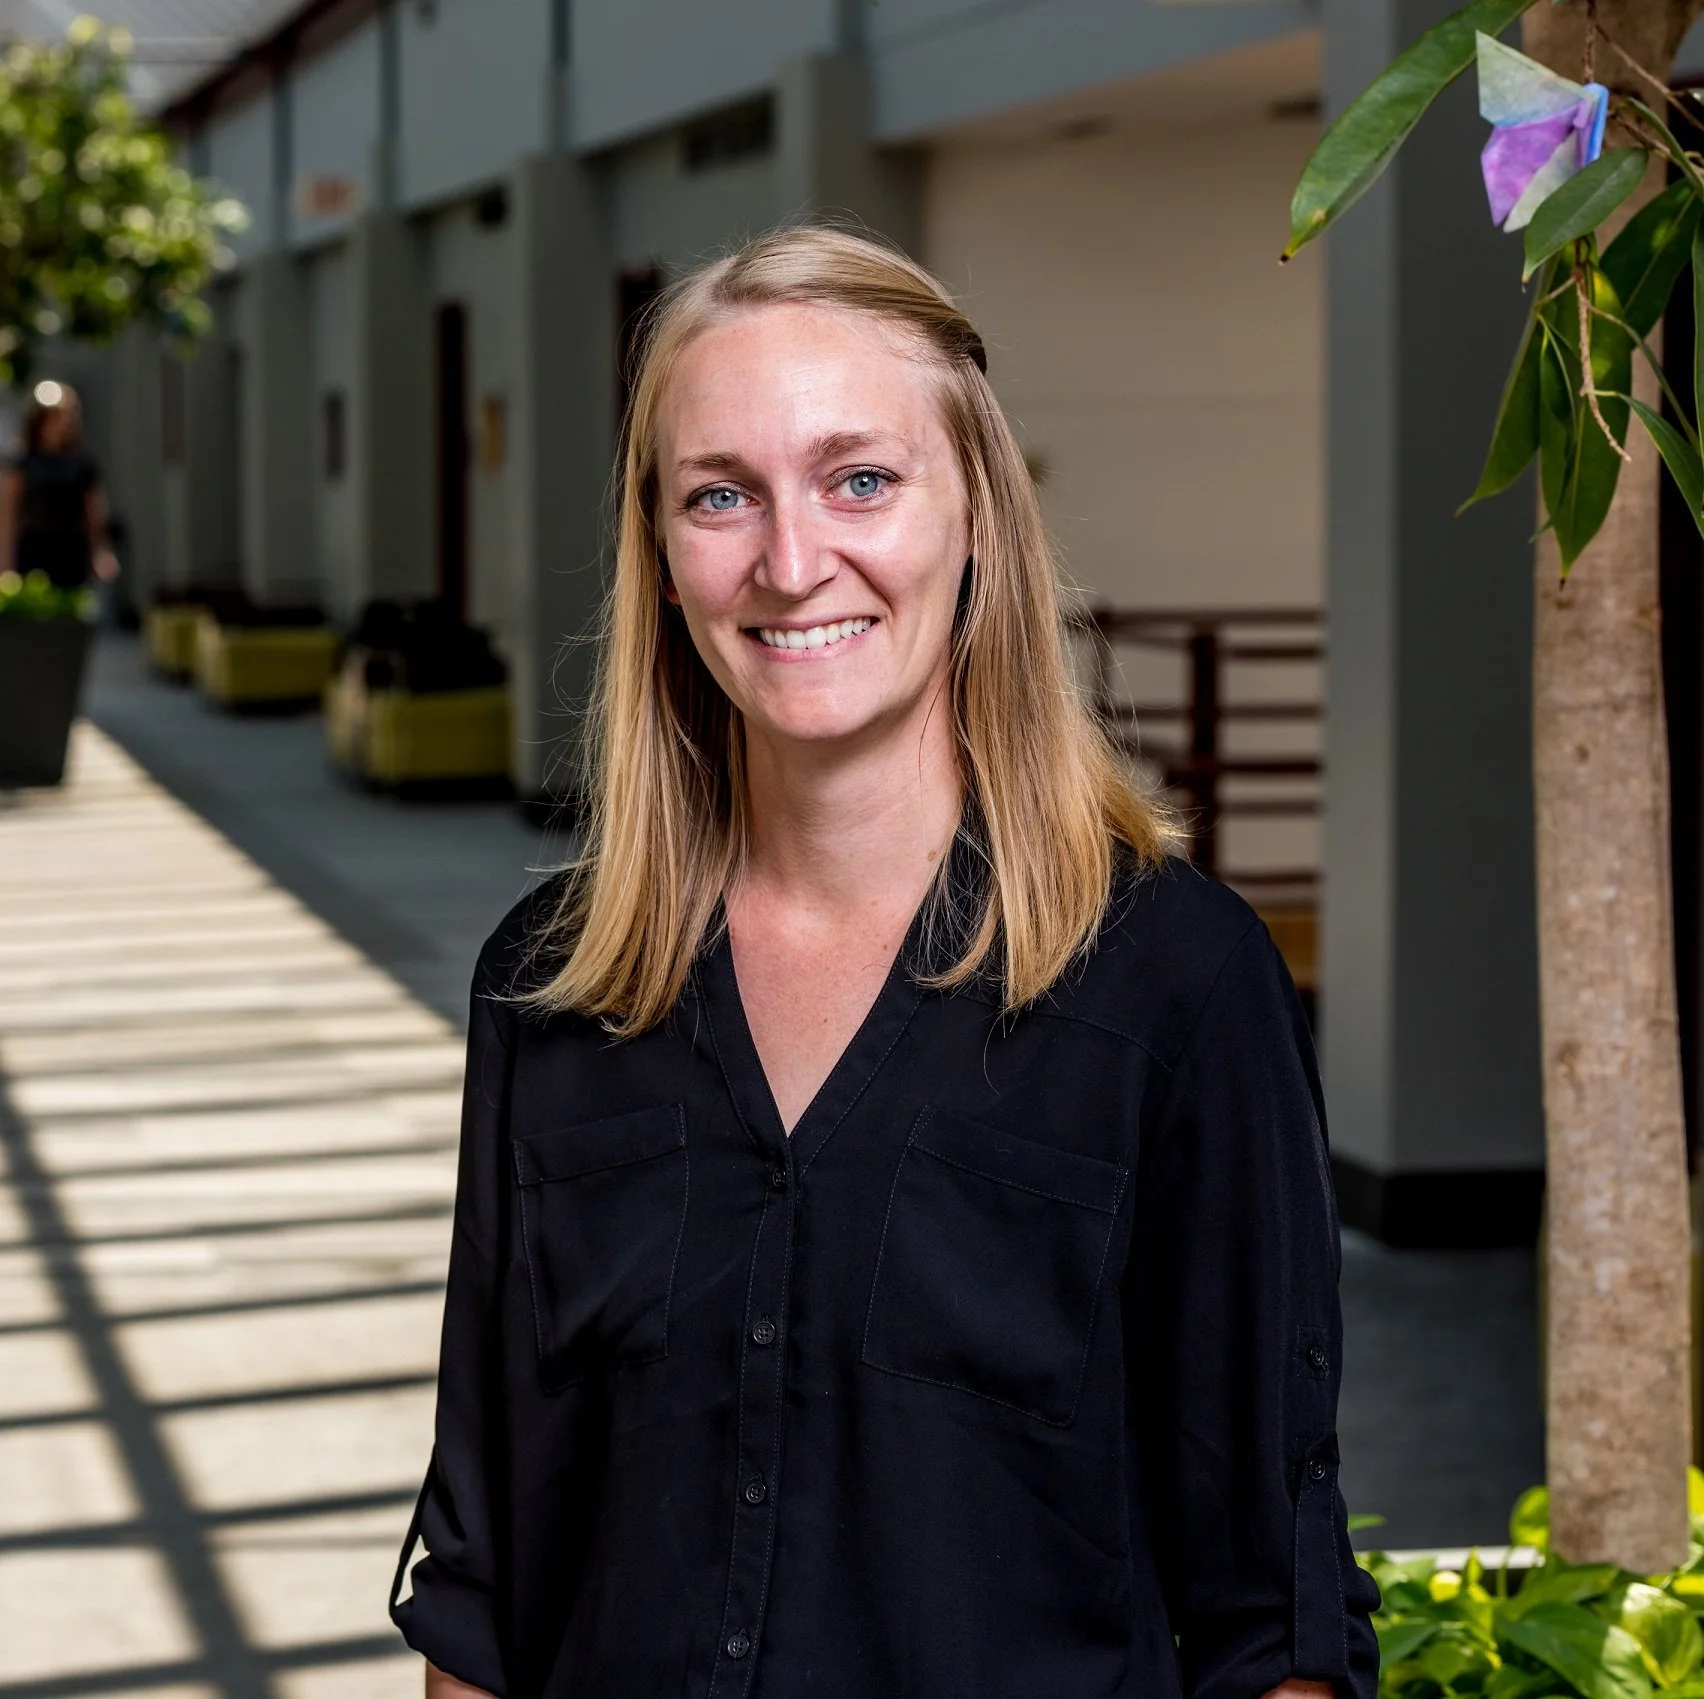
Dr. Megan Heyman
Associate Professor of Mathematics
Rose-Hulman Institute of Technology
Creating graphs that tell your story
Graphs summarize content, improve access to information, and attract readers to engage with a text. We as mathematicians are familiar with formulating and creating graphs. Even if we weren't sure how to get started, large language models could provide recommendations and code that accomplish a basic graph. However, the default graphs generated by software (or LLMs) often do not fully achieve their purpose. Instead, we need to intervene and ensure that the graphic not only has a clear purpose but also shows the data clearly and makes the message obvious. Neglecting any of these aspects could result in a graph that is not accessible to the audience or even misleads the audience! In this talk, we will review best practices for creating accessible, good graphs that will help you tell your story. Then, we'll examine some published graphics and discuss changes that would allow the graph to better communicate the intended purpose to the audience. Finally, we will use a Spotify dataset containing characteristics of Taylor Swift album tracks to generate default and subsequently improved graphs. All code and example data will be shared if you would like to bring a laptop to follow along. This demonstration uses the R statistical software, which is accessible for free, no download necessary, via the Posit cloud. It is also not necessary to have experience with R beforehand.
Infusing sustainability concepts into mathematics and statistics courses
It is common to associate the word "sustainability" with ecology or the environment. While this is not incorrect, the concept of sustainability is much broader. The United Nations defines sustainability as, “meeting the needs of the present without compromising the ability of future [sic] to meet their own needs.” The UN's 2030 Agenda for Sustainable Development contains 17 sustainable development goals (SDGs) which require urgent action and attention from everyone. As members of a global community, we share responsibility in working toward sustainability, and as teachers we are uniquely situated to help educate and motivate a broad audience about sustainability. I'll discuss experiences with infusing current, real applications of the SDGs into my undergraduate courses. The goal is that the audience will participate in an active discussion that allows everyone to leave with a stronger understanding of the SDGs, access to many relevant resources, some ideas for how to bring sustainability applications into your class, and an awareness of challenges you might face.